Search This Blog

Tuesday, January 31, 2012

Examples of efficiency

I love earnings season as I can point to practical examples of how quickly markets assimilate new information.

This season is no different

Amazon reported disappointed earnings today... It took about 3 minutes of after hours trading for the stock to drop almost $20.


The market did not like it.

Look at the volume traded!

Friday, January 27, 2012

On the Financial Media

You have to love the differences

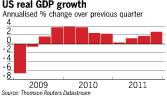
After the news of US 4th quarter GDP released today (1/27/2012) the FT reports:

US growth accelerates to 2.8%


On yahoo finance at the same time you read (from the AP)

Stocks slip after US economic growth disappoints

I may sound counter intuitive but I prefer foreign media to learn about the US and domestic media to learn about overseas. 

Wednesday, December 21, 2011

Gas Price Reversals

On an earlier post I was commenting on a disconnect between oil and gasoline prices. Oil was falling but gasoline was staying up...

Well guess what...? The very opposite is happening now... Take a look

In the last 3 months, gasoline prices have dropped from $3.55 to $3.20  while oil has fluctuated between a low of $75 per barrel to a current $100.


How long does it take to clear oil inventories? Or is it simply noise from day traders?

Tuesday, December 20, 2011

The cheaper it gets, the less I want it


Great intuitive commentary in the Financial Times yesterday about the effects of really low rates on the banking industry and the economy.

Pimco's Bill Gross argues that low rates could entice less borrowing instead of more.

Good read for students and practitioners

Wednesday, October 26, 2011

Is Pure Expectations Hypothesis useful?

Does Pure Expectations Hypothesis provide good estimates of future rates?


Does PEH matter?

Most finance students at one point or another have the Pure Expectations Hypothesis. The professor will show term structure data, and then say something like…

“If PEH holds (big if) we can use today’s data to calculate what the market expectations are for next year’s rates. “

How good are these predictions?

Based on 2010’s daily term structure data, I calculated the PEH expectations for 2011. Take a look for yourself. The chart below shows the prediction and the real outcome.


Will they come closer?

Friday, October 21, 2011

Soccer and Efficient Market Hypothesis


I always enjoy showing my students live examples of how EMH works in reality. I usually use an online earnings call while looking at the stock prices, tick by tick. This week for instance, I shared the afterhours drop in the price of Apple after their earnings miss. Students are generally impressed by this market wisdom and by how quickly prices incorporate information.

But every now and there are some situations that leave me speechless.

Coincidentally this week I witness one such moment. Please bear with me.

My favorite Chilean soccer club: Universidad de Chile (not related to any university), like many others in Chile is a publicly traded company trading under the mnemonic AZUL AZUL. Yes, imagine the Patriots, Cowboys, Sox and Yankees trading in the NYSE.

My team’s share price went up this Friday. A lot! It went up so much that the bourse had to stop trading when it had literally doubled in value.  After trading was re-started it settled for a67% gain. This on top of a 28% gain on Thursday.


The reason? On Wednesday the team had a superlative performance (4-0) against Flamengo a Brazilian team in a South-American tournament.

You can watch the beautiful 4th goal here.

I am buying some AZUL AZUL!!!

Is the Nikkei that bad?


Japanese stocks have performed badly since, ... well since what seems forever. Looking from a long term buy-and-hope strategy, had you invested in the NIKKEI in 1984 your returns would be around nada. No matter how much we complain about our financial markets and their crises, had you invested in the S&P500 you would be sitting in a 600-700% return.


 From a shorter term perspective, say after the dotcom bubble, results are similar. Japanese stocks underperform US equities. Does this mean that investors should avoid Japanese stocks? Not really. Look in the same chart how the JPY/USD is doing.


Oversimplifying calculations, and assuming that an American investor put 10,000 USD (around 1,333,333 JPY) in the Nikkei in 2002, he/she would be sitting on a20%equity loss. Today he/she would only have 1,066,666 JPY, which at the current exchange rate (75 JPY/USD) would be 14,222USD…

I don’t know about you… but I would take it.


Is the Nikkei that bad? Not if you are an American.